How the bond yield curve moves the markets

The finance industry is littered with buzzwords and jargon. Because of that ”normal folks” can feel overwhelmed and hesitant to take advantage of the opportunities that abound.
One of the things we pride ourselves on is breaking down cryptic financial jargon, so everyone can understand and move confidently.
In this post we are going to tackle the yield curve. Our hope is that when you finish reading this post. You will have an idea of what it tells you about the economy and financial markets.
What is the yield curve?
In simple terms, a yield curve is a graphical representation of current interest rates and the corresponding times to maturity.
You can create these charts on any issuer debt - government or corporate. However the yield curve of US government debt is the most watched. Market players believe that changes in the US government yield curve can predict the future state of the economy.
By no means is the yield curve an infallible signal. But it does give clues to how financial markets could move.
To learn why the US government debt / bond market is so important. Check out our posts, “The Bond Market - The market that moves all markets” and “The Government Bond Market.”
Different Yield Curve Flavors
Interest rates move constantly. Depending on where rates are and economic expectations, the yield curve can have various “shapes”. These shapes help build out a view of the financial markets.
Normal Curve
Generally speaking, a yield curve should have a consistent shape. This is because shorter maturity bonds will have lower interest rates versus longer maturities. i.e. a 2-year bond will pay you less than a 30-year bond.
The reason for this is because you have more risk holding a bond for 30 years versus 2 years. Therefore, you need to be paid higher interest for holding the bond longer.
Here is an example of what a normal yield curve should look like:
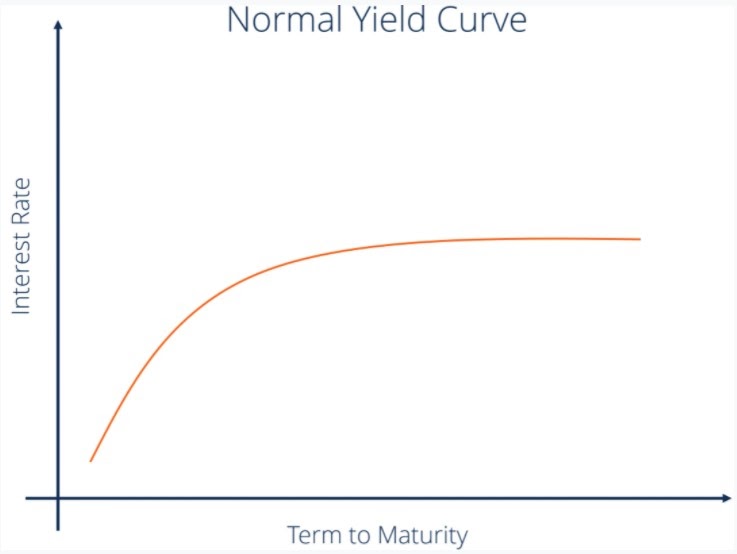
What to Expect With a Normal Yield Curve
When the yield curve is normal, the expectation is that the economy will continue to grow and inflation will rise in the future.
If these two things happen, you would assume that stock prices can rise in step with economic growth. This is beneficial for those holding equity assets.
A normal yield curve is a near ideal economic setup because the FED will likely not have to change interest rates. However, if the economy does start to overheat, interest rate changes will have to happen. And the curve shape will change.
Steeper Yield Curve
A steeper yield curve is created when longer term interest rates rise faster than short term rates. Therefore, there is a sharper rise at the front part of the yield curve.
Here is an example of what a steeper yield curve should look like:
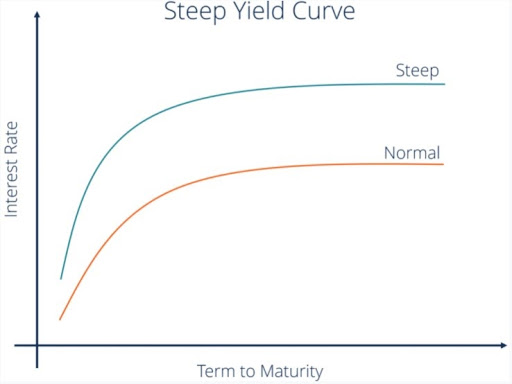
What to Expect With a Steep Yield Curve
When the yield curve starts to steepen, the expectation should be for quick growth of the economy. Usually before economic expansion or right after a recession.
Why? Because short term interest rates are low allowing for borrowers to get cheap funding to initiate growth. This can either be market driven OR artificially by the US Federal Reserve.
For example, during the initial stages of COVID, the US Federal Reserve moved short term interest rates to effectively zero. After that, the curve started to steepen and the US economy started to recover with a rapid speed.

Flat Yield Curve
A flat yield curve is usually seen during a transition period of the economy. i.e. moving from a steeper curve to normal. Or from normal to inverted (we will talk about the inverted curve shortly).
Here is an example of what a flat yield curve should look like:
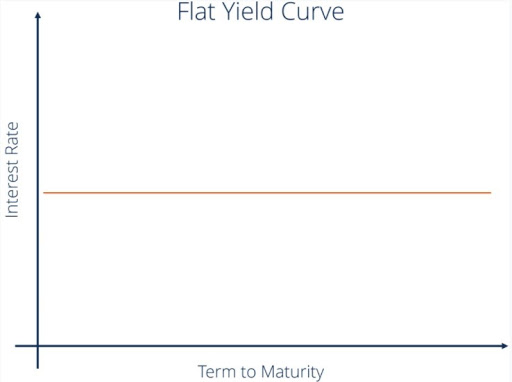
What to Expect With a Flat Yield Curve
Since a flat, or flattening yield curve, signals an economic transition. You could see a rapidly accelerating economy and rising inflation slowly turn into an economic pause. The best way to think about a flat yield curve is economic uncertainty.
Inverted Yield Curve
An inverted yield curve is one of the more sinister signals a market can see. It is formed when long term interest rates are below short term rates.
This happens because investors believe there could be an economic recession on the horizon. They prefer to lock in longer term lower rates over looking for growth. i.e. safety of their capital over everything.
Here is an example of what a inverted yield curve should look like:
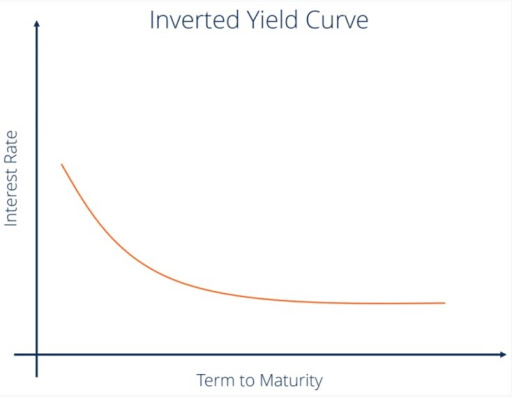
What to Expect With a Inverted Yield Curve
An inverted yield curve is considered a leading economic indicator. Meaning, if you see it, expect an economic downturn and possibly a recession. One of the many triggers of this curve shape is investor expectation that inflation will fall.
Just because the curve inverts DOES NOT mean a recession is a guarantee. But economic research has shown that it has signaled such events in the past.
Economist Campbell Harvey did work on this and published his finding in a 1986 dissertation. He also followed up this work and found that an inverted yield curve preceded a recession 8 times since 1970( link ).
The most recent curve inversion happened in 2019. Before that multiple times between 2005 and the 2007 financial crisis.
Here is a great chart from the St. Louis Federal Reserve. It highlights all curve inversions from from the 1970s till now and recessions are highlighted in grey.

Wrap Up
Just like you would use a map to find your way to a destination. Following the shape of the yield curve can help you make investing decisions.
It should never be your only source when thinking about the markets. But it should be a tool in your toolbox when thinking about what you should do with your cash.
If you are able to see the coming shifts of the yield curve. You should also be able to position your cash resources for higher probability positive outcomes.
For more educational and interesting information about the financial markets. Consider browsing our other blog posts and following our free monthly newsletter.
